Bitcoin has dropped below $67,000 for the first time in two months, triggering what analysts call a "maximum fear" environment in cryptocurrency markets. The Crypto Fear & Greed Index—a widely followed sentiment gauge that measures investor psychology on a scale from 0 (maximum fear) to 100 (maximum greed)—has plummeted to levels last seen during previous market crashes. Yet beneath this surface panic lies a counterintuitive signal: historical data suggests these extreme fear moments often precede significant price rebounds, particularly when traditional stock markets are reaching record highs. Understanding what's happening requires knowing not just what Bitcoin is, but how its price discovery mechanism works, why sentiment swings so violently, and what the data actually tells sophisticated investors about what comes next.
What Is Bitcoin and the Fear & Greed Index?
Bitcoin is a decentralized digital currency that operates on a blockchain—a shared, transparent ledger maintained by thousands of computers worldwide rather than by any central bank or government. Created in 2009 by an anonymous person or group using the pseudonym Satoshi Nakamoto, Bitcoin established the first practical system for transferring value directly between people without needing a trusted intermediary like a bank.
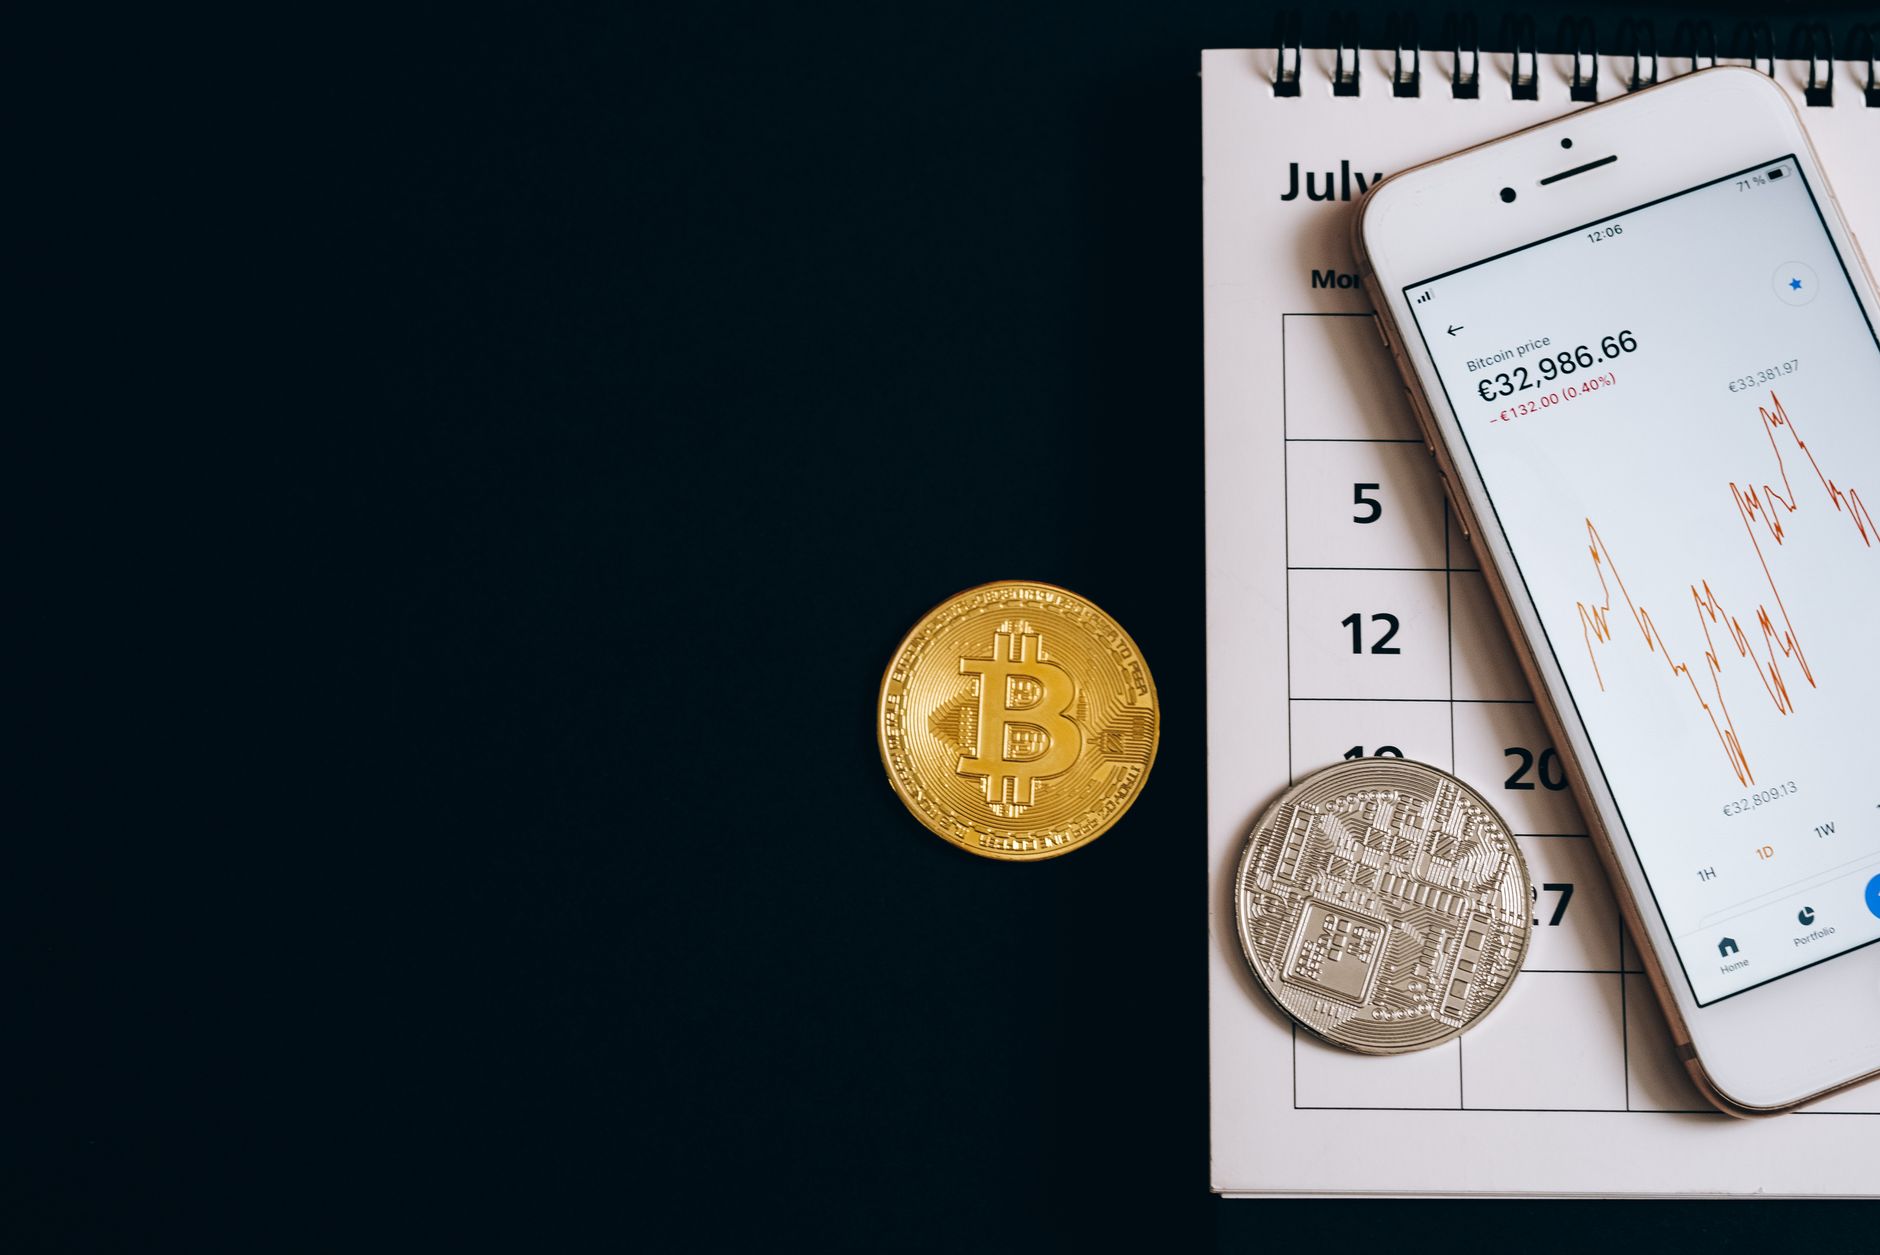
The Crypto Fear & Greed Index functions as a sentiment barometer for the entire cryptocurrency market. It aggregates data from five key sources: volatility (measuring how wildly prices swing), market momentum (analyzing price trends), social media volume (tracking how much people discuss crypto), market dominance (Bitcoin's percentage share of total crypto market value), and trends in search data. When these factors converge to show panic selling, anxiety spreads across platforms, and investors withdraw capital—the index drops toward 0. When enthusiasm peaks, with confident buying, social media celebrations, and rising prices—the index climbs toward 100. Bitcoin has hit 'max fear' below $67K as analysis sees BTC price rebound precisely because the index recently hit levels between 20-30, representing some of the most extreme panic conditions in recent years.
Why Is Bitcoin Moving Right Now?
The recent price decline below $67,000 reflects a specific convergence of market dynamics. First, macroeconomic uncertainty created headwinds across multiple asset classes. Central bank policy shifts, inflation data, and broader economic growth concerns rippled through both traditional and digital markets. Bitcoin, despite its position as a long-term store of value, remains closely correlated with risk sentiment—when investors panic about the broader economy, they often reduce exposure to any asset perceived as speculative.
Second, the cryptocurrency market experienced profit-taking after Bitcoin's strong 2024-2025 performance. When any asset class rallies substantially, investors with gains eventually sell to lock in profits. This normal market cycle created downward pressure on prices. Third, regulatory uncertainty and political developments created short-term friction. The regulatory environment for cryptocurrency remains unsettled globally, and any negative news about government crackdowns or legislation can trigger rapid selling as risk-averse investors exit positions.
Critically, Bitcoin has hit 'max fear' below $67K as analysis sees BTC price rebound because these same conditions have historically preceded rebounds. Analysts point to a specific pattern: when fear indices hit maximum extremes (below 25), capitulation—the point where panicked investors have already sold—often marks a bottom. The extreme fear reading suggests most weak-handed sellers have already exited, leaving a market dominated by committed long-term holders who are unlikely to panic-sell at depressed prices.
How Bitcoin's Price Discovery Actually Works
Unlike stocks with earnings reports or bonds with predictable yields, Bitcoin's price emerges purely from supply and demand. No cash flows support it; no interest payments exist. Instead, its value reflects what buyers and sellers believe it's worth at any given moment, influenced by adoption expectations, scarcity (only 21 million Bitcoin will ever exist, a hard mathematical limit), and its utility as a store of value or transaction medium.
Price discovery occurs across thousands of cryptocurrency exchanges globally—from massive platforms like Coinbase and Kraken to smaller regional exchanges. Bitcoin trades continuously, 24/7, with no market close. This creates rapid price adjustments as new information spreads. When fear grips markets, sellers overwhelm buyers, pushing prices down quickly. The opposite occurs during greed phases, creating rapid appreciation.
Volatility stems from several factors unique to cryptocurrency. Bitcoin markets operate with lower trading volumes than stock markets despite high valuations, meaning large buy or sell orders create outsized price impact. Additionally, the cryptocurrency market runs globally across time zones with no unified opening or closing bell, creating asymmetric information as news breaks in different regions at different times. When Bitcoin has hit 'max fear' below $67K as analysis sees BTC price rebound, these dynamics reverse—the same low liquidity that amplified the downside move can amplify upside moves as buying interest returns.
Price History and Key Milestones
Bitcoin's journey reveals critical patterns relevant to current conditions. The cryptocurrency traded below $100 in 2011, then crashed 95% before recovering. It hit $1,000 in 2013, crashed again, recovered, reached $20,000 in late 2017, then dropped 80% in 2018. Each time, extreme fear preceded recoveries. In March 2020, Bitcoin dropped below $4,000 during pandemic panic, yet recovered to new all-time highs within months. The 2021 bull market saw Bitcoin reach $69,000 before a 65% crash in 2022. Each cycle follows a similar pattern: extreme optimism leading to peaks, followed by brutal capitulation and fear, culminating in strong rebounds.
The 2024-2025 period saw Bitcoin rally strongly following Bitcoin's approval as a spot exchange-traded fund (ETF) in the United States in January 2024. This institutional acceptance drove broader adoption and legitimacy. The recent drop to $67,000 represents a pullback from higher levels, not a return to pandemic lows or 2022 bear market conditions.
What the Data Shows
Bitcoin's market capitalization stands around $1.3 trillion as of early 2026, representing roughly 40-45% of the total cryptocurrency market value. Daily trading volume fluctuates between $20-35 billion depending on volatility and market conditions. The Crypto Fear & Greed Index at maximum fear (20-25 range) now represents the lowest readings since March 2023, creating a statistical rarity. Historically, such extreme readings have reversed within 4-12 weeks, with Bitcoin gaining 15-50% during recovery periods. That analysis underpins predictions that Bitcoin has hit 'max fear' below $67K as analysis sees BTC price rebound toward previous highs.
Fear is ultimately a buying opportunity for long-term investors, because history shows that markets recover from panic, and Bitcoin's fixed supply means scarcity value reasserts itself once panic subsides.
Risks Every Investor Should Know
Cryptocurrency remains highly speculative. Bitcoin could fall further; "max fear" doesn't guarantee immediate recovery. Regulatory crackdowns, technological vulnerabilities, or shifts in adoption could fundamentally alter Bitcoin's long-term viability. Additionally, macroeconomic deterioration could depress risk assets broadly, including Bitcoin, despite historical correlations suggesting otherwise in certain scenarios.
Where Bitcoin Goes From Here
Analysts tracking the relationship between Bitcoin and stock market records note a specific dynamic: while Bitcoin has hit 'max fear' below $67K as analysis sees BTC price rebound, major stock indices continue near record highs. This divergence suggests potential "catch-up" behavior, where